FAQ
What is a "carbon footprint"?
There are certain gases notorious for being able to “trap” heat when confined in an enclosed space where sunlight can get in… you know, like a greenhouse.
Earth’s layer of atmosphere happens to be a perfect greenhouse. The thing our whole economic system runs on—fossil energy—releases a lot of carbon dioxide (CO₂), a great example of a greenhouse gas (GHG).

What does that mean in the context of food?
The carbon footprint of food is the total GHG emissions caused directly and indirectly by all activities across the “life cycle” of the food. It’s measured in kilograms of CO₂ equivalents (kg CO₂e) per kilogram of the food product.

What are the various stages of a food’s life cycle?

What are our system boundaries?
What stages do we consider when we calculate the carbon footprint of food?
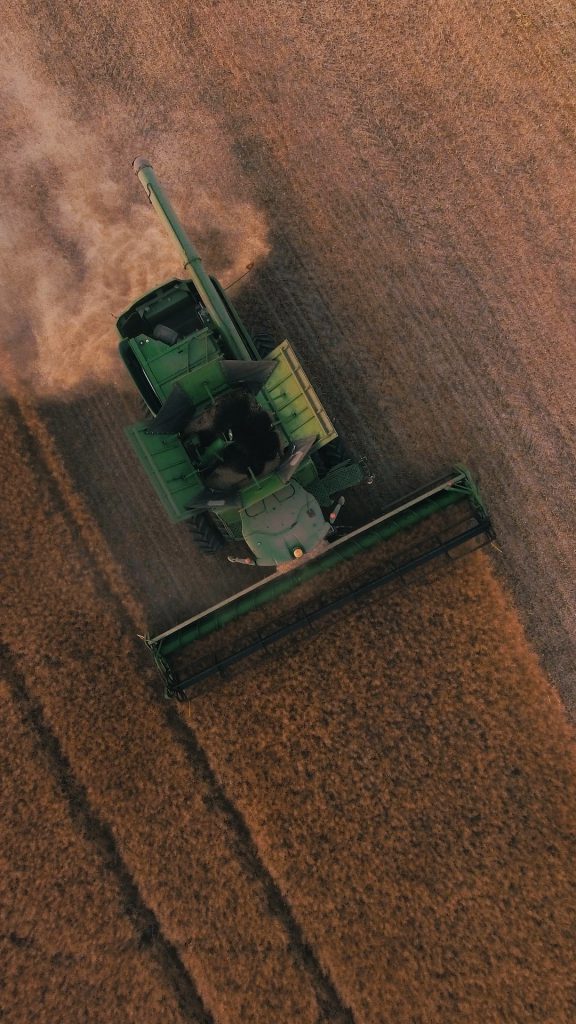
When you buy food, what you buy has only undergone some stages of its life cycle. Farming to transportation is called cradle to gate (instead of grave). The “cradle” is the farm, the “gate” is a shelf at your wholesaler or retailer. The use (cooking) and disposal phases are yet to happen.
Even though these last 2 stages have an impact, these are not considered in our analysis. Our goal is to help you make better purchasing decisions. This approach ensures that all food products are calculated in the same way, and can be fairly compared to each other. However, when you purchase items, we do give qualitative recommendations on how to reduce the impact of your cooking and food waste.

How do we calculate the life cycle carbon footprint of every food item?
Do we actually go measure them?
We don’t actually perform the LCAs simply because they’ve already been done extensively for most raw/fresh products consumed in the world today. No need to reinvent the wheel!
In many cases, multiple research institutes, universities, and think tanks have conducted LCAs for the same product but from different regions and production processes. All of this knowledge has been published in peer-reviewed journals accessible in the public domain. What we do is find all the LCA-published carbon footprints of every product type, aggregate them, obtain the median, and present the most representative value to you, so you can easily make an informed decision on what to buy and what not to.
When aggregating different LCA studies, we ensure every one of the studies has the same system boundaries—i.e. they all include the impact of feed, production, processing, packaging, and transportation—thus enabling us to fairly compare various products with one another. The methodology of the peer-reviewed papers and other databases used to build the database is consistent with international standards (ISO 14040, GHG Protocol).
How do you do this for hundreds of thousands of products?
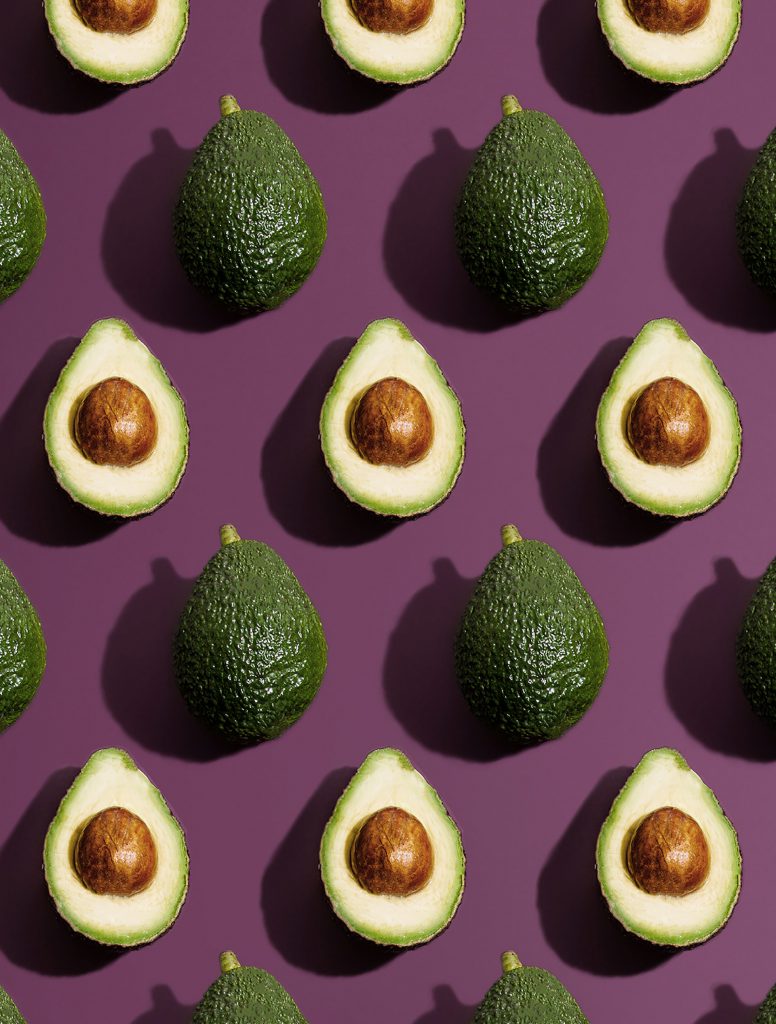
We have a model that does this automatically. Customers provide invoices and other purchasing data. Our algorithm identifies the product, usually through its barcode/EAN or the product’s name, and automatically matches them with one of the thousands of product types we have in our database. For example, “Avojoy Avocados” would be assigned to the product type “Avocados”.
But how do you know the difference between carbon footprints for the same product type?
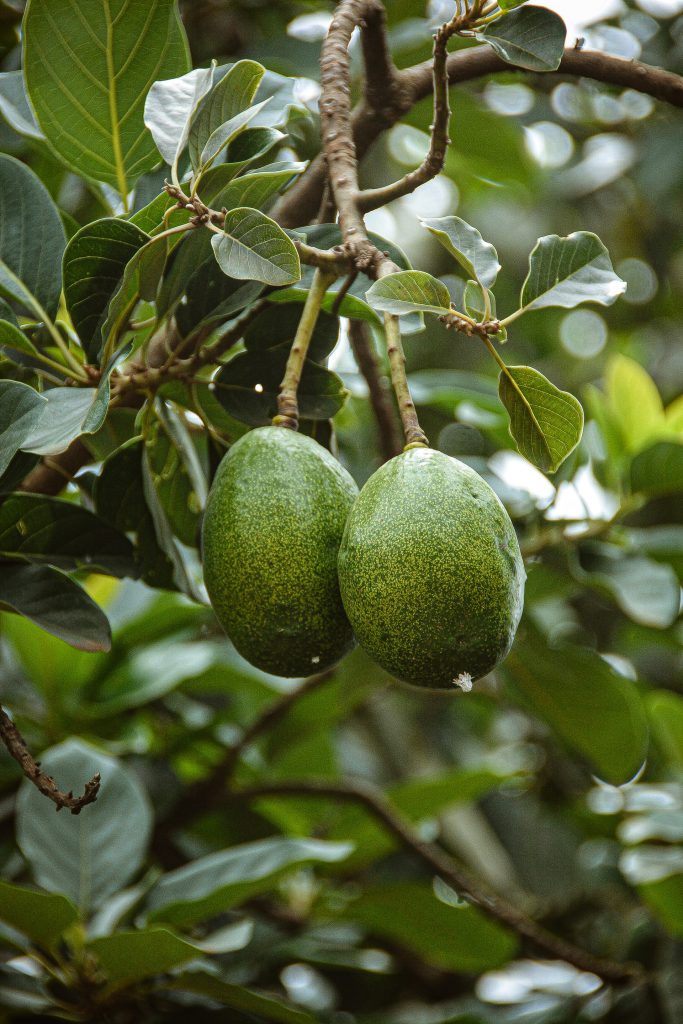
What if two avocados come from different farms?
Once we establish the average carbon footprint value of the product, we then estimate the differences between various products of the same type but made by different brands under different supply chain conditions.
When assessing avocados, we would try to find differences between a standard avocado and an Avojoy avocado. We do this by identifying attributes along the various life cycle stages of the food product that cause differences in the final impact: organic vs. conventional farming, paper vs. plastic packaging, locally produced food vs. air-freighted food, food in season vs. out of season, etc. For each attribute we identify, we apply correction factors to ensure that the carbon footprint reflects the actual journey taken by the food.
With this, we can even compare the same products when produced by different brands or manufacturers in entirely different conditions. We get this supply chain information from open-source barcode-based databases available in the public domain such as GS1 and Open Food Facts.
Okay, but what about processed foods with several ingredients?
Complex products, such as processed foods, are divided into the simplest ingredients whose carbon footprint values are in our database. The model aggregates the emissions of each ingredient in the standard recipe of the processed foods and voila… we have the CO₂e of the processed foods.

How do you define a “carbon budget” or an emissions reduction target?
To stay under the 1.5ºC limit, scientists at the IPCC came up with various emissions reductions scenarios called Shared Socioeconomic Pathways (SSP). These pathways allow us to reduce our emissions gradually by spreading the remaining carbon budget over decades instead of exhausting it in just 5 years. The reduction pathways allow us a certain emissions budget each year* which decreases progressively.
This means our industries and economic systems have to become drastically more efficient. For the food industry, this means food has to be produced much more efficiently. In technical terms, the kg CO₂ eq. emitted per kg of food produced and sold has to be below a certain limit.
This limit was calculated based on the share of the annual carbon budget allocated to the food industry under the best-case scenario for the environment and society (SSP1), and Food and Agriculture Organization’s (FAO) estimations on the amount of food produced in the same year, globally and excluding the share of emissions allocated to the use phase and end-of-life. This gives us the efficiency of food production that allows us to emit just enough GHGs to meet this year’s annual carbon budget. This is the limit we recommend our clients to reduce impact to. This is consistent with the methodology recommended by ‘Science Based Targets Industry”.
How do you classify an ingredient as good or bad?
To define a food ingredient as good or bad, we compare it with the carbon budget that limits warming to 1.5 C. If it’s above the kg CO₂ e per kg of food threshold that would allow us to limit warming to 1.5 C and stay below budget, it’s "bad”.
Otherwise, it's good.
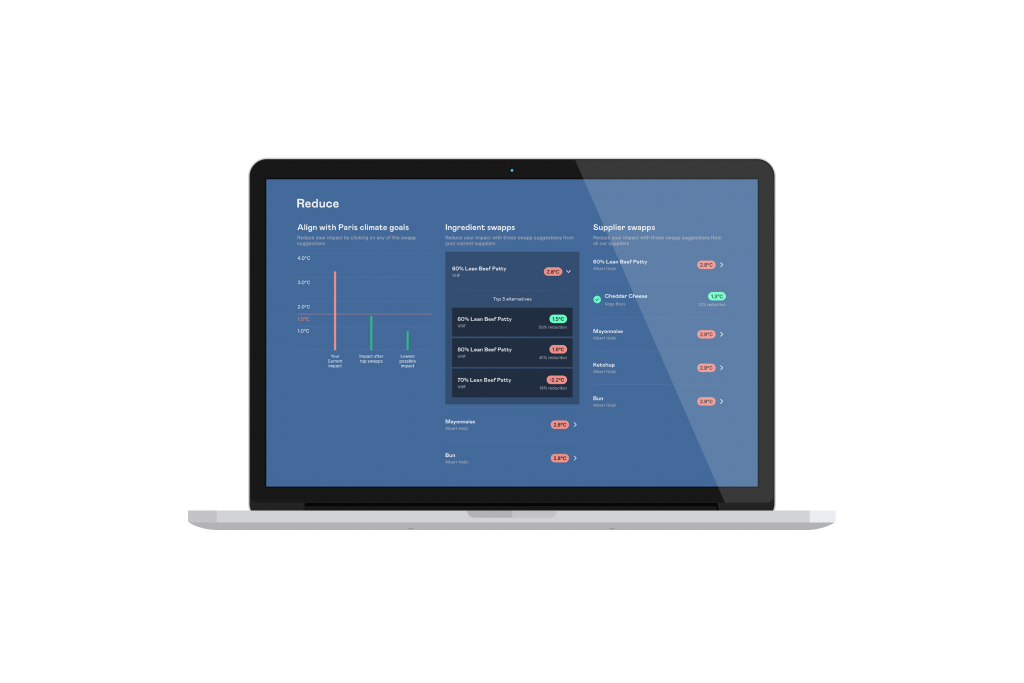
How do we come up with impact reduction recommendations?
Each product type is divided into buckets. Each bucket contains hundreds of products that are typically swappable with each other in the context of cooking meals or recipes. Our algorithm classifies products into these buckets based on several factors, such as the function it serves in recipes, taste, price, and so on. It then picks alternatives with a lower carbon footprint from the same bucket as the original product.